Colored Data Clouds
Ubiquitous Ambient Technologies as Public Urban Infrastructures
May 9, 2011essay,
With the project In the Air,1 Spanish architect Nerea Calvillo wants to make the citizens of Madrid more aware of the city’s official monitoring systems for measuring air pollution and get them involved. Through the development of interfaces, collective action can be initiated that is aimed at exchanging experiences and raising community consciousness.
This text aims to question some of the aspects of Madrid’s aerial ecosystem through the project In the Air. By visualizing the substances in the air as non-human, invisible agents, it sets out to identify their physical, social and political relation to the urban environment, with effects ranging from the interior of the human body to the image of the city. Visibility of this symmetrical relationship between humans and non humans makes it possible to shed light on its controversies and to include these in the social political debate.
In 1967 Reyner Banham described Los Angeles, identifying four ecologies that integrated the geographical, infrastructural, architectonical, social and political aspects of the city.2 This eco-systemic perspective allowed him to comprehend the interrelation and contextualization of urban systems, as well as how they are embedded in their physical and social context.
The urban milieu has been documented in almost all of its aspects, from the built environment to traffic and energy flows. However, there are equally active invisible agents, whose functioning and properties we ignore because they are invisible from a certain point of view. An example of these invisible actors is provided by the microscopic and non-human substances in the air, which are agents of the aerial ecosystem, a new ecology that could be added to Reyner Banham’s urban analysis.
The specific case of Madrid is relevant here because of its symbolic and public health implications. First, it is one of the most contaminated cities in Europe, to the extent that it has been fined several times by the European Commission. And secondly, because traditionally the city has been represented by its sky, from Velazquez’s royal equestrian paintings to contemporary pictures, accompanied by the seventeenth-century proverb and present urban marketing slogan: ‘From Madrid to the sky.’
However, the sky of the city has changed from a deep blue to a light brown, so either action must be taken to restore its previous qualities or the city may need to find new representations.
In Madrid’s official air-quality monitoring system, sensors are hosted in green steel boxes in the middle of boulevards or roundabouts, hidden by plants or trees, camouflaged to the eyes of passers-by. They become invisible devices, and their data remains invisible in the public space.
The results of these measurements are published on the City Council’s web page. As they are published in a non-computable format they can’t be used by citizens, and the highly specific data they provide make it impossible to combine different data sets and make comparisons. Therefore the analysis of this public data is relegated to experts, who are the only ones able to understand the implications.
Having seen that data in all its formats is black-boxed, the project In the Air proposes different ways of making these data public. It does so by testing prototypes of mediation devices that allow the citizen to access and understand the information emitted by means of various levels of communication.
Maps as Interactive Machines
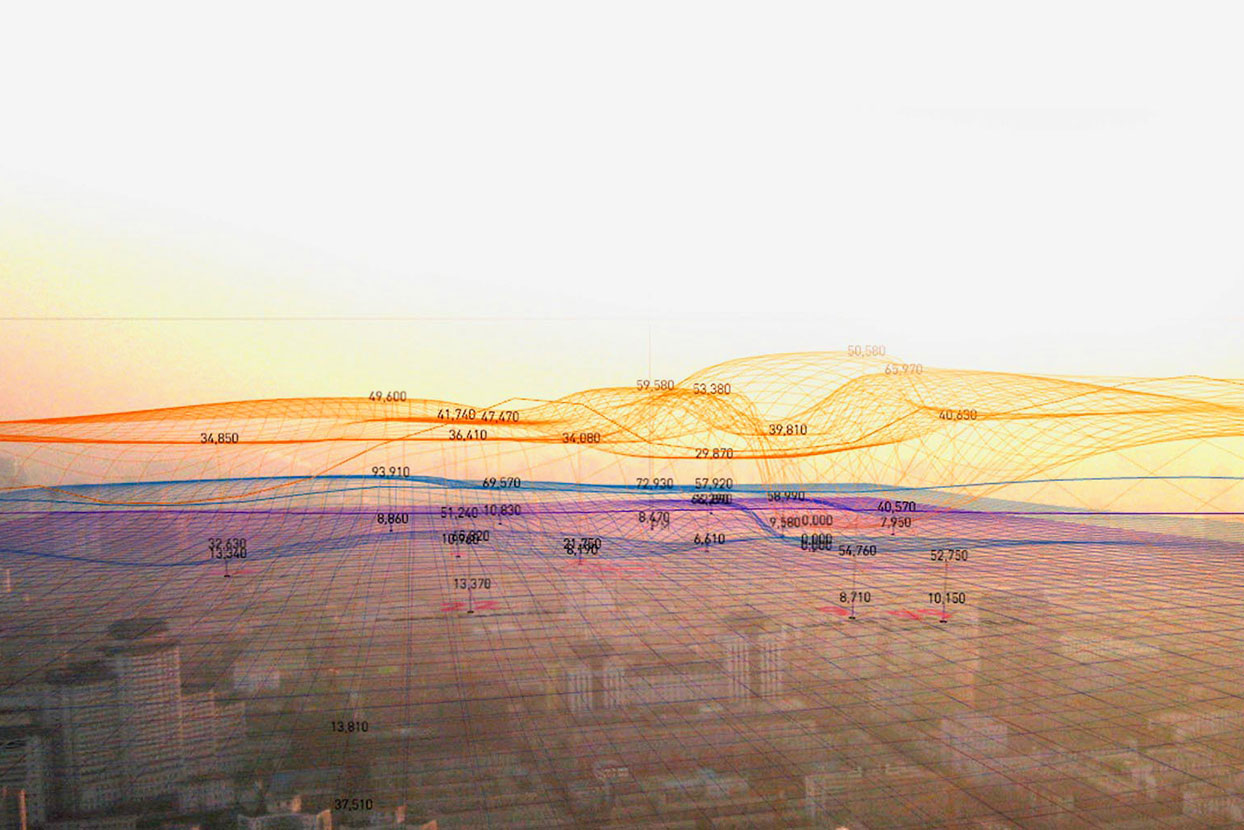
The first level of communication that was tested by the project is a virtual map, conceived as an inscription device that allows different sets of quantified data to interrelate. The map is conceived as a machine that can be activated in different ways. There are institutions that publish two-dimensional or three-dimensional air-quality maps, but they are almost never interactive, and therefore have only one way of being read.3 The application permits many of the visualization parameters to be controlled, so that the user can construct his or her own map, his own construction of reality. In this way not just one visualization is offered, but a tool that facilitates multiple interpretations.
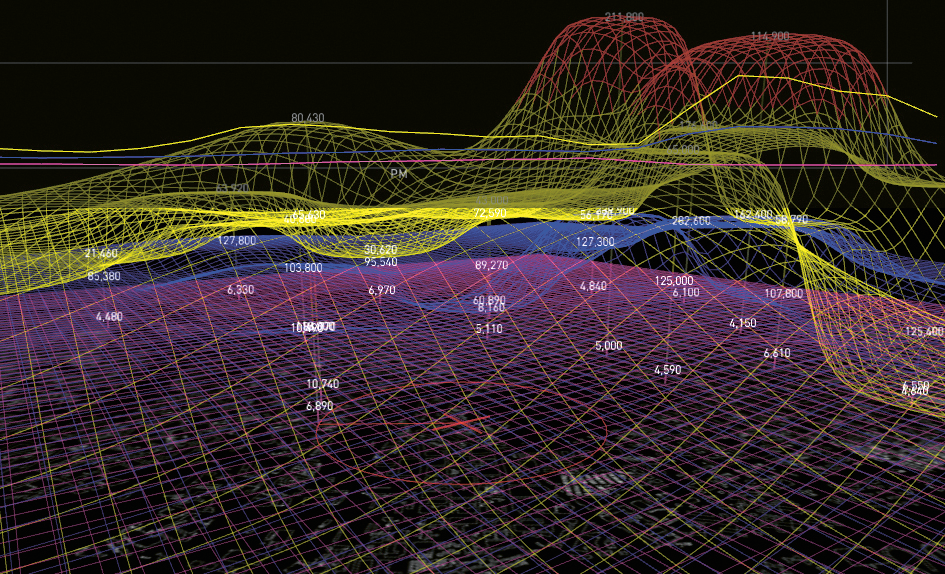
In The Air uses a geo-localized topographical mesh as an instrument to interrelate data obtained hourly in each measuring station. With it, the user can localize his or her position within the city and see the density of each of the substances, as well as their relative quantities in comparison to other points of the city.4
Each mesh corresponds to one of the five substances selected: Carbon Monoxide (co), Nitrogen Dioxide (no2), Sulphur Dioxide (so2), Ozone (O3) and Particulate Matter (pm10). This distinction allows the user to identify the different emission sources, the repercussions to human health and the possible implications of each substance, as well as the actions that can be taken to reduce their densities. In this way, the difficulty of understanding the data as a whole is mitigated by reducing it to smaller and more comprehensible fragments.
However, these maps are still online and in a virtual environment, and it is necessary to have equipment and an Internet connection to access them. Even the proliferation of 3G mobile phones can’t yet guarantee a wide access to digital information in the public realm. So it is necessary to identify possible devices that could provide access to those data in the public space, to make it possible for people to move through the city according to the density of contaminants, or to convert the public space into a public arena where urban topics can be discussed
Urban Displays
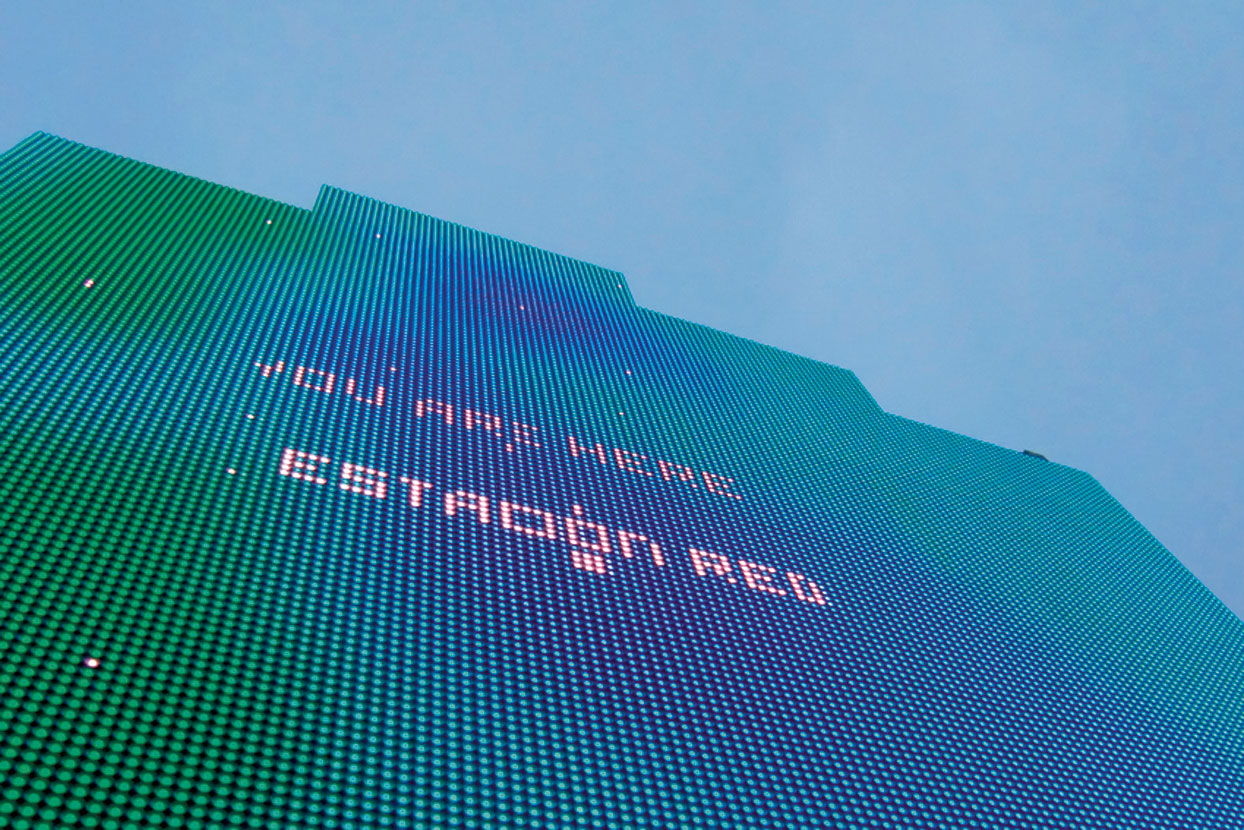
A second level of communication is the construction of devices that emit information in the urban space.
In Madrid small digital screens are used in one plaza (paradoxically at the Tourist Information Centre), where air quality is shown together with meteorological conditions. However, as has been argued above, these means are insufficient for an understanding of the general system or the local situation at any specific point in time. Instead, large digital screens could be a possible platform because they make it possible to communicate more information in a more complex way. These screens, attached to or integrated into a building, transform urban space, blurring the boundaries of architecture, juxtaposing its reflections and opening windows to multiple worlds simultaneously, as can be perceived in Times Square in New York.
Such screens generally broadcast advertisements, but are potentially public infrastructures.5 What kinds of relationships can be established between the screens and the public still needs to be evaluated with this new type of content, as it contains information of public interest it alters the spectacular relationship of advertisement and constructs a relationship of interactive reciprocity, transforming the spectator into a user. In the Air has developed an application for this format, in which the citizen can choose pollution paths through the city by using heat maps.
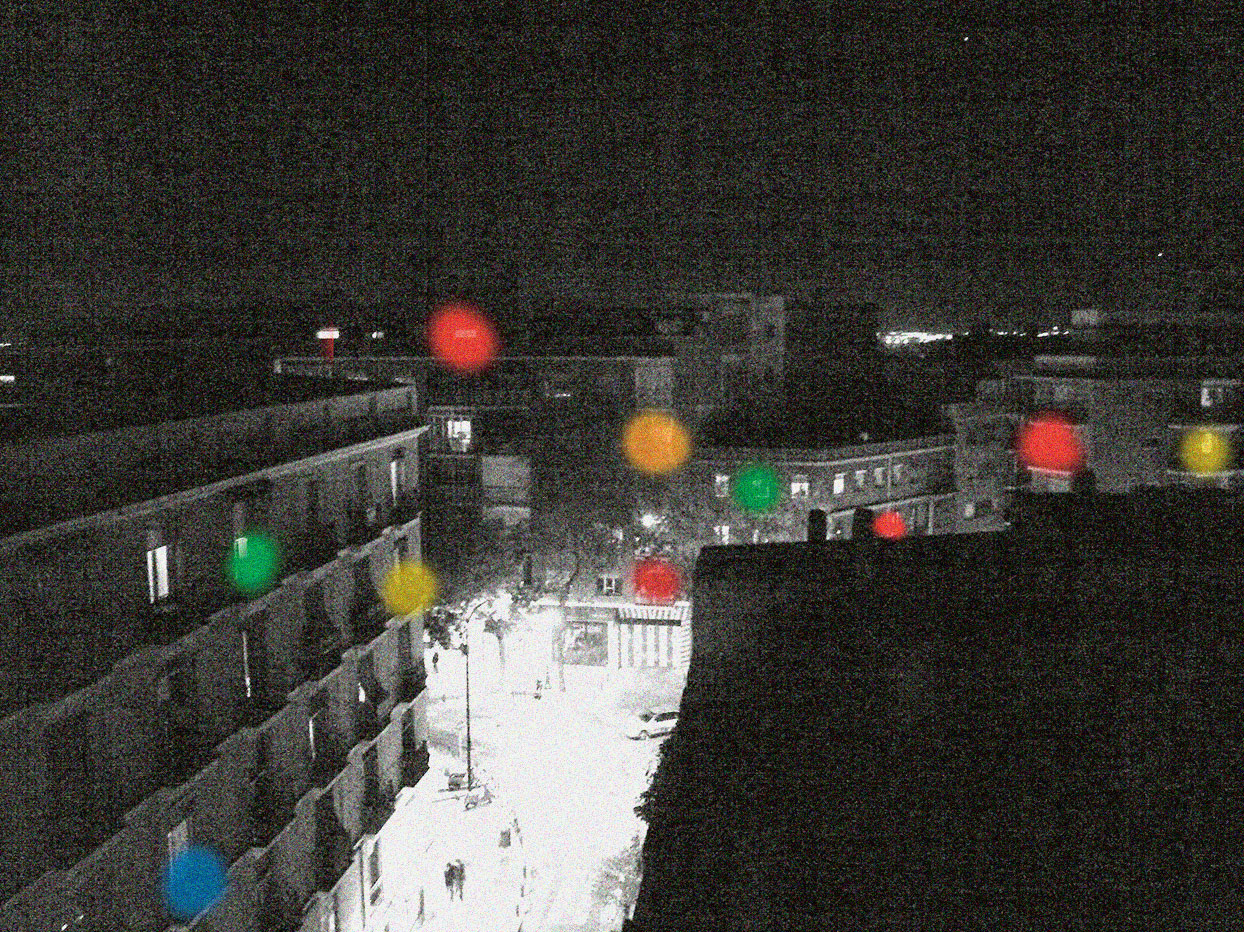
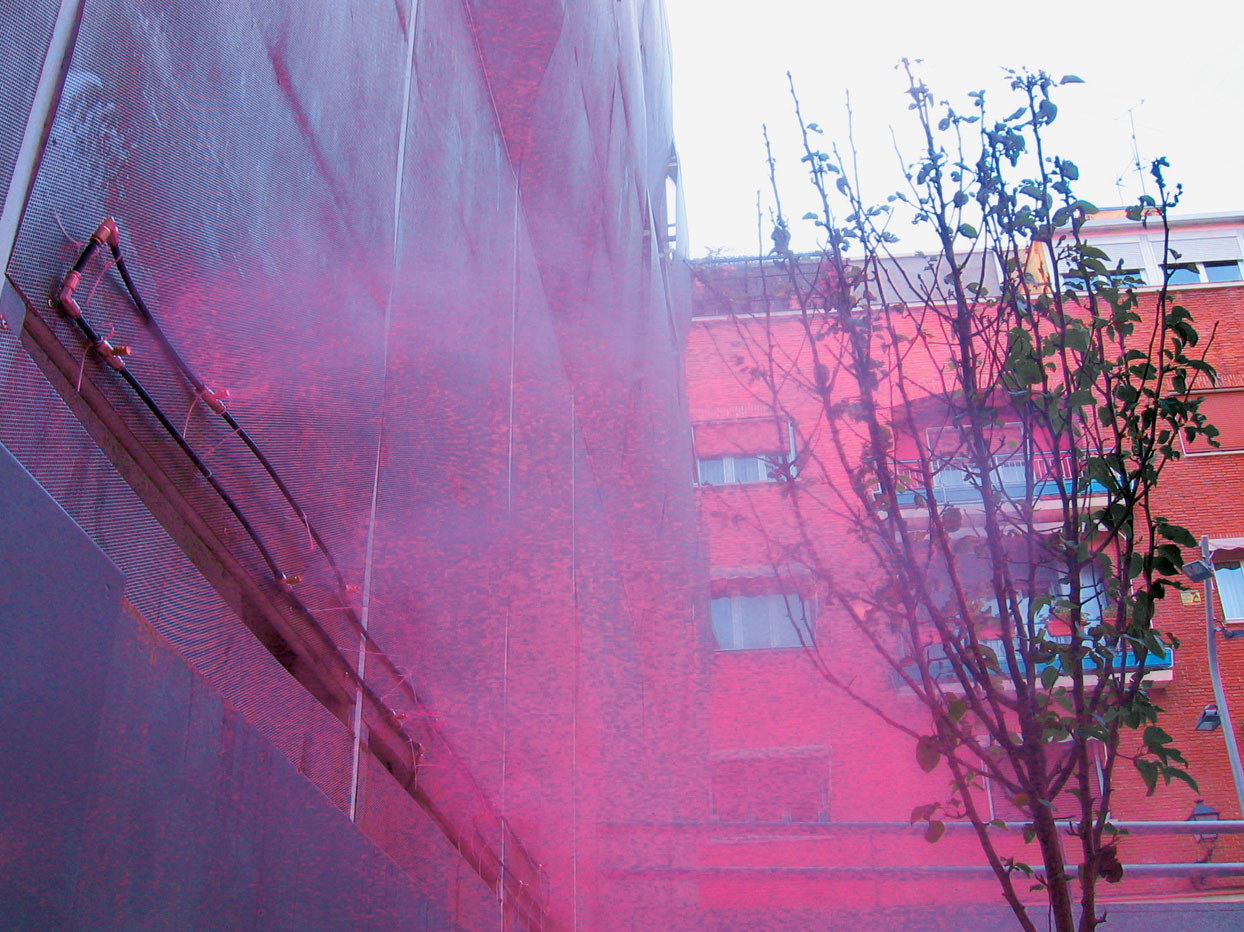
Also, another type of screen has been designed and prototyped. It consists of coloured water vapour, and uses the elements of analysis as a visualization medium. The intensity, colour and rhythm of vapour emissions encode the various substances, their density and their trend. This display is a prototype of what has been called a ‘diffused façade’, because it builds a blurred interface between a solid façade and the urban space around it. This ephemeral interface has several functions: first, it contains and provides information on the air quality in real time, then it transforms urban space by reducing the temperature and increasing the humidity, and finally it reduces the levels of pollution because it causes sedimentation of the chemical substances. It therefore constitutes a giant air-quality indicator, consisting of a coloured cloud that blends architecture with the atmosphere it has invaded and that mediates with the bodies it surrounds.
Mobile Displays
Another family of displays that the project has tested are small mobile devices that convert the citizen into a data visualizer. These can be just pollution visualizers in the shape of led-pins, or devices that can provide more complex information, like a compass, which identifies pollution densities and their direction with respect to the users’ position, as if it were an emergency exit indicator.
One could say that sensor networks are likely to be infrastructural to the extent that they facilitate the production or use of other systems, although they have different properties than what is traditionally called ‘hard infrastructure’, such as communication and transport systems, materials or fluids. It is a network of discrete, small-scale and low-budget technological elements, as opposed to continuous and large-scale ones. Infrastructures could also be understood as a series of artefacts. But it would be interesting to broaden the spectrum and to understand them as well as cultural production objects with spatial content, as ‘soft infrastructures’.6
So what is proposed by In the Air is to integrate these hard and soft properties, in which the infrastructure is not only the detection network, but includes all data visualization systems, and to expand, as far as possible, the potential use of each of its parts by the general public. That is, the public infrastructure would consist of the whole data management system, from its sensor networks to its reception and public use.
Although the construction of the monitoring and detection networks are implemented mostly by public institutions (in the European Union this has already been mandatory for three decades), research on its implementation, display and on sensor types are taking place these days mainly in universities and small businesses with environmental interests.7
In the case of Madrid the first network to measure air quality was implemented in 1968 by the Department to Combat Pollution of the city council. Since then it has been updating and renewing the equipment and the network. As of today the Integrated System of Monitoring, Prediction and Information of Air Pollution consists of 28 measuring stations, making it one of the largest in the European Union (Paris has seven, Budapest nine, for example, although London has more than 50). Research on sensors takes place at the uned University, and the gmsma department of the Polytechnic University of Madrid develops the visualization and simulation systems in collaboration with specialized companies. Finally, projects that seek to embrace all of these fields, like In the Air, have been developed by unregulated and informal groups around media labs or art centres based on ‘antidisciplinary’ design.8
One purpose of an infrastructure is to organize the coexistence of different modes and speeds of presence in the urban space as one of the first ways to make it public. That is why the ambition of In the Air is to become a platform for individual and collective consciousness and a tool for decision making, because it recognizes the political implications of the production of significance. In order to achieve this it will need to be activated by citizens, and therefore various intensities of participation are proposed.
The display of data in both digital devices and in the urban space can be used in real time to navigate the city. The topography and heat maps that reveal routes of low pollution might facilitate a bike ride or a walk with children or elderly people. Although these are just a few examples, since they suggest multiple readings and multiple actions.
The accumulation of historical data can be used as a database for urban planning. For the exhibition ‘Habitar’, some maps were produced that integrated data from areas in which in 2008 the limits of Particulate Matter were exceeded with data on the urban fabric, such as population density or land prices.9 These data can be used by citizens (to buy a home, for example), and by planners (to locate future infrastructures, regulate traffic, etcetera). Also, historical data can be interpreted as indicators of urban life, where football matches, holidays, traffic jams or demonstrations can be identified so that the data not only has a quantitative application, but also a qualitative one, allowing the construction of new urban narratives.
In parallel, the project proposes another way of participation when it comes to data production. A domestic detector-visualizer kit is being developed that citizens will be able to assemble and put on their balconies or rooftops. On the one hand this would allow the production of data on a larger scale, increasing the resolution of the mesh. On the other hand the production of independent data would make it possible to make comparisons with official data, to ensure political transparency and to measure air quality at strategic points with no measuring devices. This massive domestic production of data would collectivize the maintenance and care of public infrastructure by replacing expensive equipment and specialized monitoring with voluntary control and caretaking, moving its perception from an external right to a common good.
The effects of these management systems are not only behavioural, but also relate to perception. As infrastructures they do construct subjectivity, conditioning the relations and the ‘care between strangers’. They seek to produce experience and community, not only by proposing alternative imaginaries, but mostly by developing situations that enhance encounters and intensified exchanges of experience.
However, research still needs to be done on what might be achieved by the interaction of all these materials, human and non-human, as an evolutionary cybernetic design. Or what it means, in definitive, to inhabit coloured data clouds in the city.
1. In the Air is an ongoing project initiated in 2008 by the author of this text, and has been developed through collaborative workshops with 30 international collaborators. See www.intheair.es.
2. Reyner Banham, The Architecture of Four Ecologies (Berkeley, CA: California University Press, 1995).
3. A main reference for the project was provided by the maps of the London Air Quality Network. See www.londonair.org.uk.
4. This topography doesn’t resemble a gas and doesn’t move as a fluid, because it pretends that people become part (mentally or physically) of the model. This strategy is called ‘simulation’ in AI studies, as opposed to ‘mimesis’. In a mimetic process the attention is centred on the aspect of things, in a simulation process the attention is centred on the identification with the object. In mimesis there is an emphasis on fiction, and on the contrary in a simulation the interest is to transform fiction into reality. In: Claudia Gianetti, Estética digital (Barcelona: L’angelot, 2002).
5. As could be tested at the Media Facades Festival 2010: www.mediafacades.eu.
6. Alexander D’Hooghe, The Objectification of Infrastructure: The Cultural Project of Suburban Infrastructure Design (Berlin: Jovis Verlag GmbH, 2010).
7. Large-scale environmental sensing projects are being developed by the Centre for Embedded Network Sensing, University of California; wireless monitoring networks applied to cities by Harvard Sensor Networks Lab, Harvard School of Engineering and Applied Sciences; the identification of new parameters or indicators by SENSEable City Lab, MIT; or the production of visualization systems and participation by xDesign Environmental Health Clinic, NYU, among others.
8. Andrew Pickering, The Cybernetic Brain (Chicago and London: The Chicago University Press, 2010).
9. ‘Habitar’ exhibition. Curator: Jose Luis de Vicente, held at the Laboral Centro de Arte y Creación Industrial, Gijón, 2010.
Nerea Calvillo is an architect and researcher who studied at the Escuela Tecnica Superior de Arquitectura de Madrid (ETSAM). She was awarded the Fulbright grant to pursue studies at Columbia University (MsAAD), she received her doctorate in 2014. She has worked at NO.MAD and Foreign Office Architects (FOA) before funding her own office C+ (2004), winning several national and international competitions. Her work and articles have been published in architecture magazines, academic journals and general media.